Market Outlook
November 07, 2016
Market Cues
Domestic Indices
Chg (%)
(Pts)
(Close)
Indian markets are likely to open flat after witnessing volatility over the last week.
BSE Sensex
(0.6)
(156)
27,274
Like other global markets Indian markets will also take a wait and watch approach
Nifty
(0.6)
(51)
8,434
before the outcome of US presidential elections.
Mid Cap
(1.3)
(175)
12,840
Small Cap
(2.2)
(290)
12,877
U.S. markets closed lower Friday, marking the S&P 500’s longest losing streak since
the depths of the financial crisis, Uncertainty over the presidential election outcome
Bankex
(0.6)
(136)
21,781
weighed on investors. US market could see sharp movement either side post
outcome of U.S. presidential election.
Global Indices
Chg (%)
(Pts)
(Close)
Indian markets remained weak for the last week amid volatility in the global
Dow Jones
(0.2)
(42)
17,888
markets. The US elections outcome would be a key trigger for global markets and till
Nasdaq
(0.2)
(12)
5,046
then it is very unlikely that the market will see broader participation. Further index
FTSE
(1.4)
(97)
6,693
heavy weight like ICICI Bank and SBI will come out with their quarter results during
Nikkei
(1.3)
(229)
16,905
the week, which could lend some directions to the markets.
Hang Seng
(0.2)
(41)
22,643
Result Review
Shanghai Com
(0.1)
(4)
3,125
Radico Khaitan Q2FY17
Slippages under control for PNB
Advances / Declines
BSE
NSE
Detailed analysis on Pg2
Advances
668
223
Investor’s Ready Reckoner
Declines
2,262
1,436
Unchanged
111
40
Key Domestic & Global Indicators
Stock Watch: Latest investment recommendations on 150+ stocks
Volumes (` Cr)
Refer Pg6 onwards
BSE
4,545
Top Picks
NSE
23,947
CMP
Target
Upside
Company
Sector
Rating
(`)
(`)
(%)
Amara Raja Batteries Auto & Auto Ancill.
Buy
1,007
1,218
21.0
Net Inflows (` Cr)
Net
Mtd
Ytd
HCL Tech
IT
Buy
794
1,000
25.9
FII
73
(637)
44,378
Asian Granito
Capital Goods
Buy
260
351
35.1
MFs
107
287
22,339
Equitas Holdings
Financials
Buy
172
235
36.4
Navkar Corporation Others
Buy
196
265
35.3
More Top Picks on Pg4
Top Gainers
Price (`)
Chg (%)
Shreecem
16,799
4.3
Key Upcoming Events
Previous
Consensus
Hcltech
794
4.2
Date
Region
Event Description
Reading
Expectations
Itc
249
3.6
Nov 08 China
Exports YoY%
(10.00)
(5.80)
Colpal
984
3.4
Nov 08 UK
Industrial Production (YoY)
0.70
0.80
Indhotel
112
2.8
Nov 09 US
Initial Jobless claims
265.00
260.00
Nov 10 China
Consumer Price Index (YoY)
1.90
2.10
Nov 10 India
Imports YoY%
(2.50)
Top Losers
Price (`)
Chg (%)
Nov 10 China
Industrial Production (YoY)
6.10
6.20
6.(
Sunpharma
653
(7.4)
More Events on Pg5
Cox&Kings
205
(7.1)
Piind
839
(7.0)
Gvkpil
7
(6.4)
Jindalstel
69
(6.3)
As on November 04, 2016
Market Outlook
November 07, 2016
Result Review
Radico Khaitan Rating Accumulate CMP `135 TGT `147
“For 2QFY2017, Radico Khaitan had reported result above our estimates both on
top-line and bottom-line front. Revenues raised 11% YoY to `447cr, which is
higher than our estimate of `396cr. On the operating front, the company’s margin
improved by 52bp YoY to 12.7%, primarily on account of a favourable shift in the
product mix from regular to premium products which command higher margins.
The company reported a ~27% YoY rise in its net profit for the quarter to `21.8cr
on the back of improvement in volume and healthy operating performance.
The company has not performed well in the last two years due to increasing raw
material costs (ENA is a key raw material) and with it not receiving significant price
hikes from various states. We expect the company to perform well going forward
in anticipation of better price hikes and healthy sales growth in premium products.
This would result in an overall improvement in the operating margin of the
company. We currently have an ACCUMULATE rating on the stock.”
Slippages under control for PNB
After witnessing sharp deterioration in the asset quality in the last few quarters,
PNB has reported some stability in the NPA numbers during Q2FY17. Gross
Slippages at `5,089 was on expected line and this together with decent recovery
helped in maintaining a stable asset quality during the quarter. Loan growth
continued to be muted growing by only 3.4% YoY. Slippages were under control
and GNPAs has not gone up, which is a positive development, however one needs
to wait for few more quarter to see if the trend has change and Asset quality will
start improving.
Economic and Political News
UK PM Theresa May arrives in India on three day visit
Coastal economic zone may get 10 year tax exemption in next budget
Smartphone sales up 40% on festival offer
Patanjali Ayurveda to invest `1,300 cr in Assam
Corporate News
Maruti Suzuki working to develop low cost hybrid model for India
BoB cuts MCLR rate by 10 bps
HCC gets relief under RBI’s S4A scheme
Market Outlook
November 07, 2016
Quarterly Bloomberg Brokers Consensus Estimate
ICICI Bank Ltd - Nov 7, 2016
Particulars ( ` cr)
2QFY17E
2QFY16
y-o-y (%)
1QFY17
q-o-q (%)
Net profit
2,109
3,030
(30.4)
2,232
(5.5)
Godrej Consumer Products Ltd Consol - Nov 7, 2016
Particulars ( ` cr)
2QFY17E
2QFY16
y-o-y (%)
1QFY17
q-o-q (%)
Net sales
2,334
2,242
4.1
2,120
10.1
EBITDA
375
407
(7.8)
380
(1.2)
EBITDA margin (%)
16.1
18.2
17.9
Net profit
251
287
(12.7)
244
2.9
Britannia Ltd - Nov 7, 2016
Particulars ( ` cr)
2QFY17E
2QFY16
y-o-y (%)
1QFY17
q-o-q (%)
Net sales
2395
2208
8.5
2162
10.8
EBITDA
351
325
8.0
316
11.1
EBITDA margin (%)
14.7
14.7
14.6
Net profit
243
218
11.5
219
11.0
Ashok Leyland Ltd - Nov 8, 2016
Particulars ( ` cr)
2QFY17E
2QFY16
y-o-y (%)
1QFY17
q-o-q (%)
Net sales
4,205
4,879
(13.8)
4,176
0.7
EBITDA
422
594
(29.0)
476
(11.4)
EBITDA margin (%)
10.0
12.2
11.4
Net profit
196
292
(32.7)
291
(32.5)
Bharat Forge Ltd - Nov 8, 2016
Particulars ( ` cr)
2QFY17E
2QFY16
y-o-y (%)
1QFY17
q-o-q (%)
Net sales
996
1,092
(8.8)
889
12.1
EBITDA
289
321
(10.1)
244
18.2
EBITDA margin (%)
29.0
29.4
27.5
Net profit
157
175
(10.3)
122
28.6
Bharat Heavy Electricals Ltd - Nov 8, 2016
Particulars ( ` cr)
2QFY17E
2QFY16
y-o-y (%)
1QFY17
q-o-q (%)
Net sales
4,597
5,835
(21.2)
5,523
(16.8)
EBITDA
(198)
(474)
0.0
71
0.0
EBITDA margin (%)
(4.3)
(8.1)
1.3
Net profit
(90)
(205)
0.0
78
0.0
Market Outlook
November 07, 2016
Top Picks ★★★★★
Large Cap
Market Cap
CMP
Target
Upside
Company
Rationale
(` Cr)
(`)
(`)
(%)
To outpace battery industry growth due to better technological
Amara Raja Batteries
17,198
1,007
1,218
21.0
products leading to market share gains in both the
automotive OEM and replacement segments.
The stock is trading at attractive valuations and is factoring all
HCL Tech
1,12,042
794
1,000
25.9
the bad news.
Back on the growth trend, expect a long term growth of 14%
Infosys
2,22,987
971
1,249
28.6
to be a US$20bn in FY2020.
Source: Company, Angel Research
Mid Cap
Market Cap
CMP
Target
Upside
Company
Rationale
(` Cr)
(`)
(`)
(%)
We expect the company would report strong profitability
Asian Granito
782
260
351
35.1
owing to better product mix, higher B2C sales and
amalgamation synergy.
Among the top 4 players in the consumer durables segment.
Bajaj Electricals
2,521
250
306
22.7
Improved profitability backed by turn around in E&P segment.
Strong order book lends earnings visibility.
Favourable outlook for the AC industry to augur well for
Cooling products business which is out pacing the market
Blue Star
5,125
538
634
18.0
growth. EMPPAC division's profitability to improve once
operating environment turns around.
With a focus on the low and medium income (LMI) consumer
Dewan Housing Finance
9,309
297
350
17.7
segment, the company has increased its presence in tier-II &
III cities where the growth opportunity is immense.
Strong loan growth backed by diversified loan portfolio and
Equitas Holdings
5,780
172
235
36.4
adequate CAR. ROE & ROA likely to remain decent as risk of
dilution remains low. Attractive valuations considering growth.
Economic recovery to have favourable impact on advertising
& circulation revenue growth. Further, the acquisition of a
Jagran Prakashan
6,012
184
225
22.3
radio business (Radio City) would also boost the company's
revenue growth.
Speedier execution and speedier sales, strong revenue visibilty
Mahindra Lifespace
1,664
406
522
28.7
in short-to-long run, attractive valuations
We expect the company to report strong growth on back of
healthy growth in domestic branded sales (owing to
Mirza International
1,059
88
113
28.3
aggressive ad spend and addition in the number of EBOs &
multi-brand outlets [MBOs]) and healthy export revenues.
Massive capacity expansion along with rail advantage at ICD
Navkar Corporation
2,792
196
265
35.3
as well CFS augurs well for the company.
Strong brands and distribution network would boost growth
Siyaram Silk Mills
1,432
1,528
1,714
12.2
going ahead. Stock currently trades at an inexpensive
valuation.
Market leadership in Hindi news genre and no. 2 viewership
ranking in English news genre, exit from the radio business,
TV Today Network
2,029
340
385
13.2
and anticipated growth in ad spends by corporates to benefit
the stock.
Source: Company, Angel Research
Market Outlook
November 07, 2016
Key Upcoming Events
Global economic events release calendar
Date
Time
Country
Event Description
Unit
Period
Bloomberg Data
Last Reported Estimated
Jun 7, 2016
2:30PM
Euro Zone
Euro-Zone GDP s.a. (QoQ)
% Change
1Q F
0.50
0.50
11:00AM
India
RBI Reverse Repo rate
%
Jun 7
6.00
6.00
11:00AM
India
RBI Cash Reserve ratio
%
Jun 7
4.00
4.00
11:00AM
India
RBI Repo rate
%
Jun 7
6.50
6.50
Jun 8, 2016
2:00PM
UK
Industrial Production (YoY)
% Change
Apr
(0.20)
(0.40)
7:00AM
China
Consumer Price Index (YoY)
% Change
May
2.30
2.20
Jun 9, 2016
China
Exports YoY%
% Change
May
(1.80)
(4.00)
6:00PM
US
Initial Jobless claims
Thousands
Jun 4
267.00
270.00
Jun 10, 2016
India
Imports YoY%
% Change
May
(23.10)
--
India
Exports YoY%
% Change
May
(6.70)
--
5:30PM
India
Industrial Production YoY
% Change
Apr
0.10
(0.60)
Jun 12, 2016
11:00AM
China
Industrial Production (YoY)
% Change
May
6.00
6.00
Jun 14, 2016
12:00PM
India
Monthly Wholesale Prices YoY%
% Change
May
0.34
--
2:00PM
UK
CPI (YoY)
% Change
May
0.30
--
Jun 15, 2016
2:00PM
UK
Jobless claims change
% Change
May
(2.40)
--
US
Producer Price Index (mom)
% Change
May
0.20
--
6:45PM
US
Industrial Production
%
May
0.66
(0.10)
2:30PM
Euro Zone
Euro-Zone CPI (YoY)
%
May F
(0.10)
--
Jun 16, 2016
11:30PM
US
FOMC rate decision
%
Jun 15
0.50
0.50
6:00PM
US
Consumer price index (mom)
% Change
May
0.40
0.20
4:30PM
UK
BOE Announces rates
% Ratio
Jun 16
0.50
--
Jun 17, 2016
6:00PM
US
Housing Starts
Thousands
May
1,172.00
1,164.00
6:00PM
US
Building permits
Thousands
May
1,130.00
1,145.00
Jun 22, 2016
7:30PM
Euro Zone
Euro-Zone Consumer Confidence
Value
Jun A
(7.00)
--
7:30PM
US
Existing home sales
Million
May
5.45
--
Source: Bloomberg, Angel Research
Market Outlook
November 07, 2016
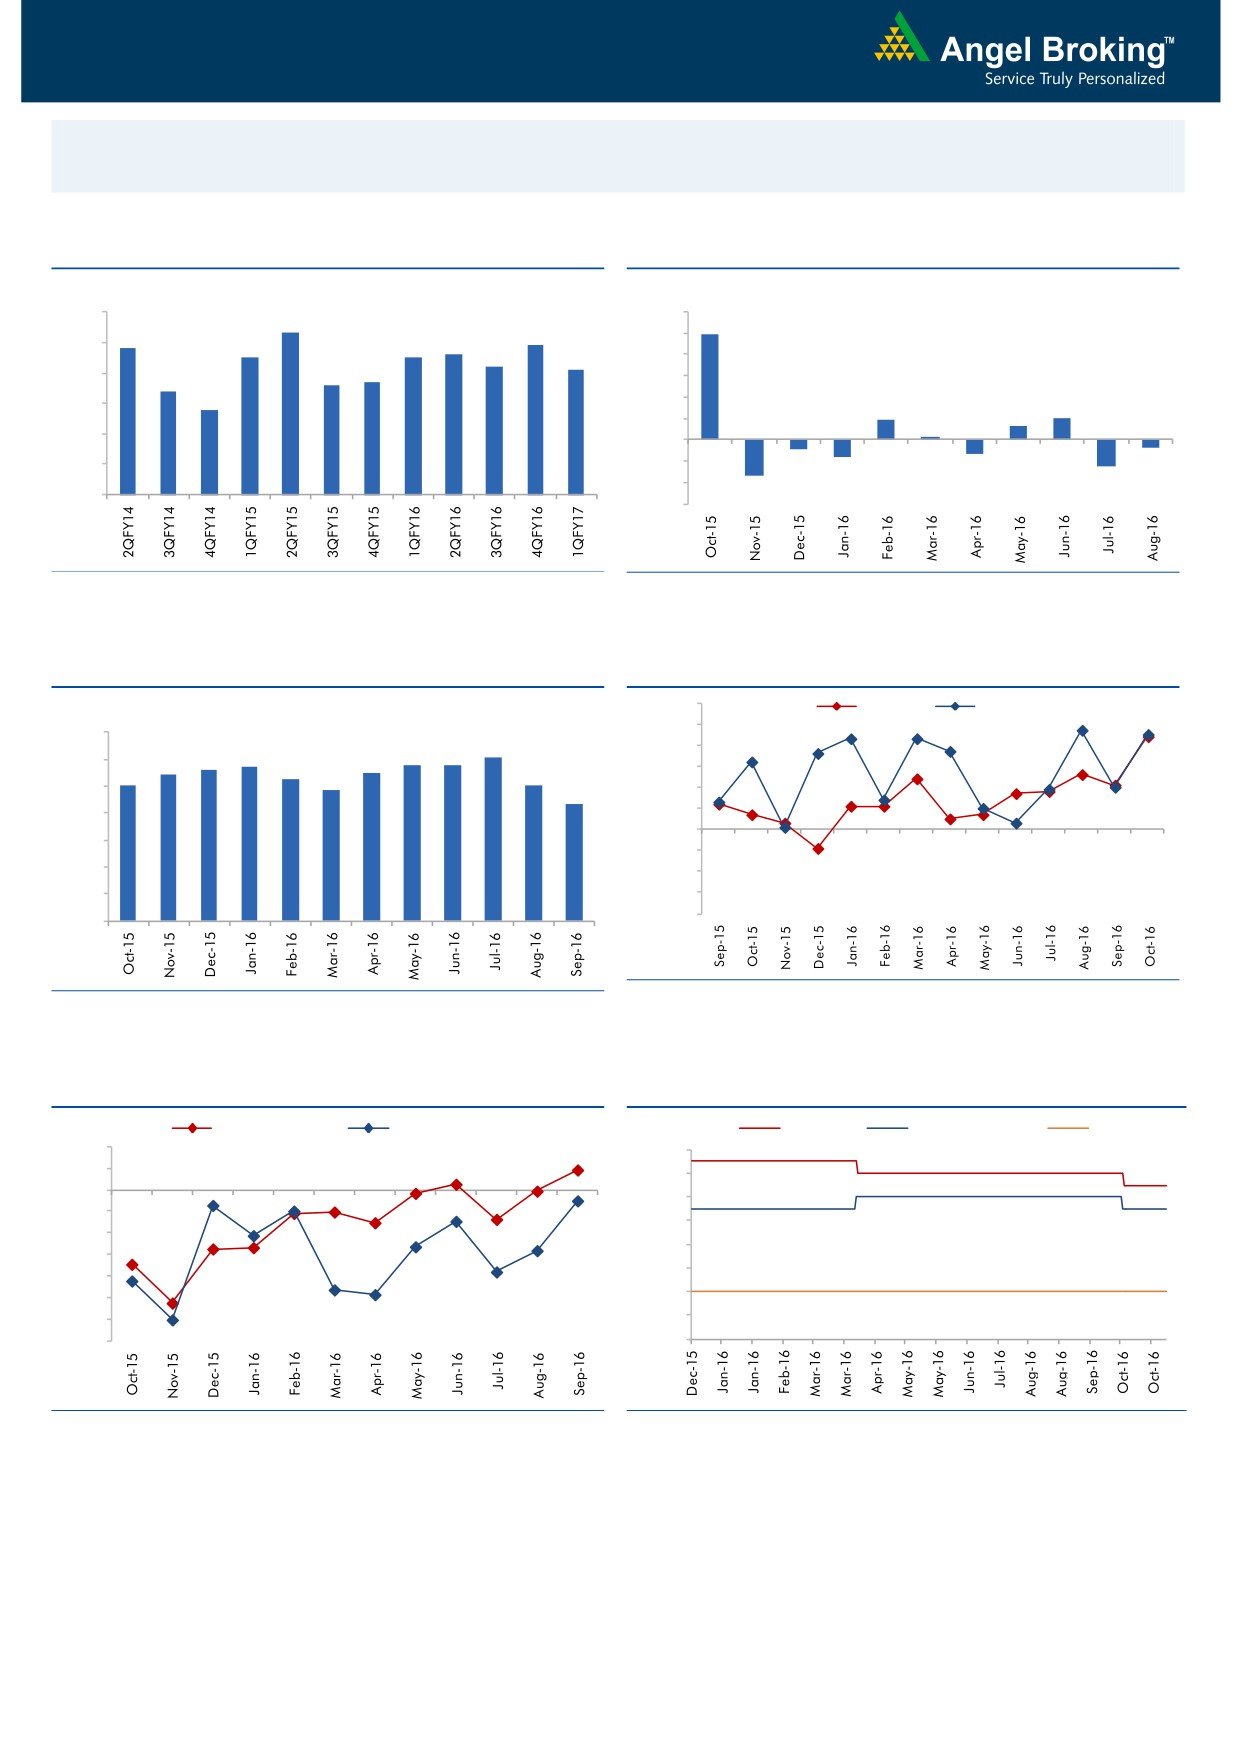
Macro watch
Exhibit 1: Quarterly GDP trends
Exhibit 2: IIP trends
(%)
(%)
9.0
12.0
8.3
9.9
7.8
7.9
10.0
8.0
7.5
7.5
7.6
7.2
7.1
8.0
6.6
6.7
7.0
6.4
6.0
5.8
6.0
4.0
1.9
2.0
1.3
2.0
0.3
5.0
-
4.0
(2.0)
(0.7)
(0.9)
(1.3)
(1.6)
(4.0)
(2.5)
3.0
(3.4)
(6.0)
Source: CSO, Angel Research
Source: MOSPI, Angel Research
Exhibit 3: Monthly CPI inflation trends
Exhibit 4: Manufacturing and services PMI
56.0
Mfg. PMI
Services PMI
(%)
55.0
7.0
6.1
54.0
5.6
5.7
5.8
5.8
6.0
5.4
5.5
5.0
5.3
5.1
53.0
4.8
5.0
4.3
52.0
4.0
51.0
50.0
3.0
49.0
2.0
48.0
1.0
47.0
46.0
-
Source: Market, Angel Research; Note: Level above 50 indicates expansion
Source: MOSPI, Angel Research
Exhibit 5: Exports and imports growth trends
Exhibit 6: Key policy rates
(%)
Exports yoy growth
Imports yoy growth
(%)
Repo rate
Reverse Repo rate
CRR
10.0
7.00
5.0
6.50
0.0
6.00
(5.0)
5.50
(10.0)
5.00
(15.0)
4.50
(20.0)
4.00
(25.0)
(30.0)
3.50
(35.0)
3.00
Source: Bloomberg, Angel Research
Source: RBI, Angel Research
Market Outlook
November 07, 2016
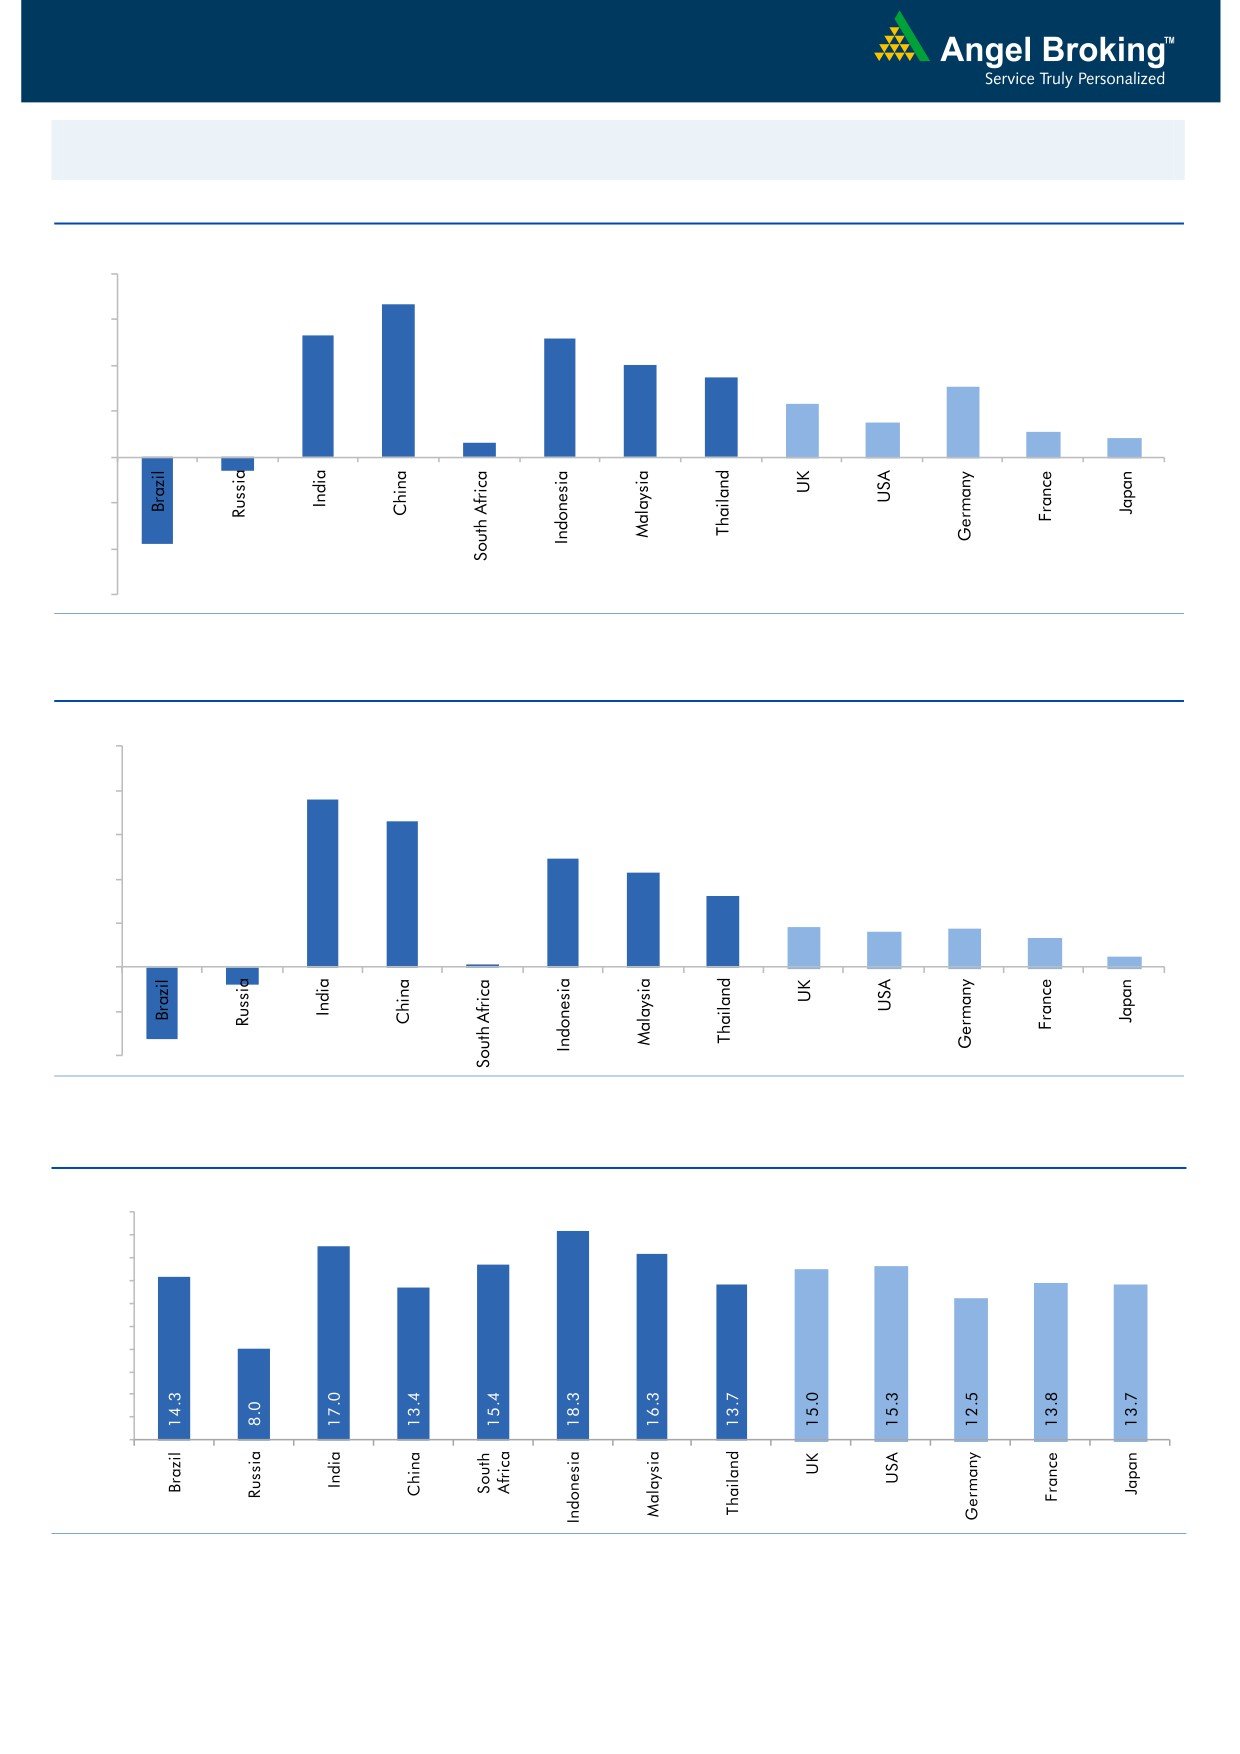
Global watch
Exhibit 1: Latest quarterly GDP Growth (%, yoy) across select developing and developed countries
(%)
8.0
6.7
6.0
5.3
0.6
5.2
4.0
3.5
4.0
3.1
2.3
1.5
2.0
1.1
0.8
-
(2.0)
(0.6)
(4.0)
(3.8)
(6.0)
Source: Bloomberg, Angel Research
Exhibit 2: 2016 GDP Growth projection by IMF (%, yoy) across select developing and developed countries
(%)
10.0
7.6
8.0
6.6
6.0
4.9
4.3
4.0
3.2
1.8
1.7
1.6
2.0
1.3
(0.8)
0.5
(3.3)
0.1
-
(2.0)
(4.0)
Source: IMF, Angel Research
Exhibit 3: One year forward P-E ratio across select developing and developed countries
(x)
20.0
18.0
16.0
14.0
12.0
10.0
8.0
6.0
4.0
2.0
-
Source: IMF, Angel Research
Market Outlook
November 07, 2016
Exhibit 4: Relative performance of indices across globe
Returns (%)
Country
Name of index
Closing price
1M
3M
1YR
Brazil
Bovespa
61,598
3.6
7.9
35.0
Russia
Micex
1,963
(1.1)
0.9
11.3
India
Nifty
8,434
(3.5)
(2.3)
3.2
China
Shanghai Composite
3,125
4.6
4.4
(9.0)
South Africa
Top 40
43,230
(4.6)
(4.8)
(11.9)
Mexico
Mexbol
46,695
(2.5)
(0.5)
3.2
Indonesia
LQ45
913
(2.4)
(1.2)
12.7
Malaysia
KLCI
1,648
(0.9)
(0.7)
(2.3)
Thailand
SET 50
926
(3.9)
(2.8)
0.6
USA
Dow Jones
17,888
(2.1)
(3.5)
(0.1)
UK
FTSE
6,693
(4.8)
(1.5)
6.3
Japan
Nikkei
16,905
1.8
1.6
(10.8)
Germany
DAX
10,259
(3.1)
(1.0)
(5.1)
France
CAC
4,377
(2.5)
(0.9)
(9.0)
Source: Bloomberg, Angel Research
Stock Watch
November 07, 2016
Company Name
Reco
CMP
Target
Mkt Cap
Sales ( Čcr )
OPM(%)
EPS (Č)
PER(x)
P/BV(x)
RoE(%)
EV/Sales(x)
(Č)
Price ( Č)
( Č cr )
FY17E FY18E
FY17E
FY18E
FY17E
FY18E
FY17E
FY18E
FY17E
FY18E
FY17E
FY18E
FY17E
FY18E
Agri / Agri Chemical
Rallis
Neutral
209
-
4,068
1,937
2,164
13.3
14.3
9.0
11.0
23.2
19.0
4.1
3.5
18.4
19.8
2.1
1.9
United Phosphorus
Neutral
672
-
34,083
15,176
17,604
18.5
18.5
37.4
44.6
18.0
15.1
3.5
2.9
21.4
21.2
2.4
2.0
Auto & Auto Ancillary
Ashok Leyland
Buy
91
111
25,784
22,407
26,022
10.6
10.6
5.2
6.4
17.4
14.1
3.9
3.3
23.6
24.7
1.2
1.0
Bajaj Auto
Neutral
2,813
-
81,409
25,093
27,891
19.5
19.2
143.9
162.5
19.6
17.3
5.5
4.7
30.3
29.4
3.0
2.6
Bharat Forge
Accumulate
833
875
19,392
7,726
8,713
20.5
21.2
35.3
42.7
23.6
19.5
4.4
3.9
18.9
20.1
2.6
2.2
Eicher Motors
Neutral
23,930
-
64,996
16,583
20,447
17.5
18.0
598.0
745.2
40.0
32.1
13.7
10.4
41.2
38.3
3.7
3.0
Gabriel India
Accumulate
118
130
1,696
1,544
1,715
9.0
9.3
5.4
6.3
21.9
18.8
4.1
3.7
18.9
19.5
1.1
0.9
Hero Motocorp
Accumulate
3,283
3,541
65,556
30,958
34,139
15.7
15.7
193.6
208.3
17.0
15.8
6.6
5.5
34.2
30.5
2.0
1.8
Jamna Auto Industries Neutral
211
-
1,682
1,486
1,620
9.8
9.9
15.0
17.2
14.0
12.2
3.1
2.6
21.8
21.3
1.2
1.1
L G Balakrishnan & Bros Neutral
643
-
1,009
1,302
1,432
11.6
11.9
43.7
53.0
14.7
12.1
2.1
1.9
13.8
14.2
0.9
0.8
Mahindra and Mahindra Neutral
1,372
-
85,242
46,534
53,077
11.6
11.7
67.3
78.1
20.4
17.6
3.3
2.9
15.4
15.8
1.8
1.6
Maruti
Neutral
5,715
-
172,628
69,186
82,217
14.7
14.4
198.5
241.4
28.8
23.7
5.6
4.5
20.2
20.0
2.2
1.8
Minda Industries
Neutral
375
-
2,977
2,728
3,042
9.0
9.1
68.2
86.2
5.5
4.4
1.3
1.0
23.8
24.3
1.2
1.0
Motherson Sumi
Neutral
303
-
42,453
45,896
53,687
7.8
8.3
13.0
16.1
23.2
18.8
7.5
6.0
34.7
35.4
1.0
0.8
Rane Brake Lining
Neutral
967
-
765
511
562
11.3
11.5
28.1
30.9
34.4
31.3
5.3
4.8
15.3
15.0
1.6
1.5
Setco Automotive
Neutral
40
-
537
741
837
13.0
13.0
15.2
17.0
2.6
2.4
0.4
0.4
15.8
16.3
1.1
1.0
Tata Motors
Neutral
512
-
147,854
300,209
338,549
8.9
8.4
42.7
54.3
12.0
9.4
1.9
1.6
15.6
17.2
0.6
0.5
TVS Motor
Neutral
392
-
18,645
13,390
15,948
6.9
7.1
12.8
16.5
30.8
23.7
7.7
6.1
26.3
27.2
1.4
1.2
Amara Raja Batteries
Buy
1,007
1,218
17,198
5,429
6,471
17.5
17.6
35.3
43.5
28.5
23.2
6.5
5.3
25.3
24.8
3.0
2.5
Exide Industries
Neutral
189
-
16,057
7,439
8,307
15.0
15.0
8.1
9.3
23.3
20.3
3.3
2.9
14.3
16.7
1.8
1.6
Apollo Tyres
Buy
194
235
9,852
12,877
14,504
14.3
13.9
21.4
23.0
9.0
8.4
1.4
1.2
16.4
15.2
0.9
0.9
Ceat
Buy
1,200
1,450
4,855
7,524
8,624
13.0
12.7
131.1
144.3
9.2
8.3
1.7
1.4
19.8
18.6
0.7
0.6
JK Tyres
Neutral
137
-
3,102
7,455
8,056
15.0
15.0
21.8
24.5
6.3
5.6
1.3
1.1
22.8
21.3
0.5
0.5
Swaraj Engines
Neutral
1,336
-
1,659
660
810
15.2
16.4
54.5
72.8
24.5
18.4
7.6
6.9
31.5
39.2
2.3
1.9
Subros
Neutral
158
-
950
1,488
1,681
11.7
11.9
6.4
7.2
24.7
22.1
2.6
2.4
10.8
11.4
0.9
0.7
Indag Rubber
Neutral
181
-
476
286
326
19.8
16.8
11.7
13.3
15.5
13.6
2.6
2.5
17.8
17.1
1.3
1.2
Capital Goods
ACE
Neutral
50
-
499
709
814
4.1
4.6
1.4
2.1
36.0
24.0
1.5
1.4
4.4
6.0
0.9
0.8
BEML
Neutral
879
-
3,662
3,451
4,055
6.3
9.2
31.4
57.9
28.0
15.2
1.7
1.5
6.3
10.9
1.2
1.0
Bharat Electronics
Accumulate
1,300
1,414
31,196
8,137
9,169
16.8
17.2
58.7
62.5
22.1
20.8
3.4
3.1
44.6
46.3
2.8
2.5
Stock Watch
November 07, 2016
Company Name
Reco
CMP
Target
Mkt Cap
Sales ( Čcr )
OPM(%)
EPS (Č)
PER(x)
P/BV(x)
RoE(%)
EV/Sales(x)
(Č)
Price ( Č)
( Č cr )
FY17E
FY18E
FY17E
FY18E
FY17E
FY18E
FY17E
FY18E
FY17E
FY18E
FY17E
FY18E
FY17E
FY18E
Capital Goods
Voltas
Accumulate
360
407
11,904
6,511
7,514
7.9
8.7
12.9
16.3
27.9
22.1
5.0
4.4
16.7
18.5
1.6
1.3
BGR Energy
Neutral
114
-
822
16,567
33,848
6.0
5.6
7.8
5.9
14.6
19.3
0.8
0.8
4.7
4.2
0.2
0.1
BHEL
Neutral
135
-
33,018
28,797
34,742
-
2.8
2.3
6.9
58.7
19.6
1.0
1.0
1.3
4.8
0.8
0.6
Blue Star
Buy
538
634
5,125
4,283
5,077
5.9
7.3
14.9
22.1
36.1
24.3
7.0
5.9
20.4
26.4
1.2
1.0
Crompton Greaves
Neutral
77
-
4,795
5,777
6,120
5.9
7.0
3.3
4.5
23.2
17.0
1.0
1.0
4.4
5.9
0.8
0.7
Greaves Cotton
Neutral
135
-
3,289
1,755
1,881
16.8
16.9
7.8
8.5
17.3
15.9
3.5
3.2
20.6
20.9
1.6
1.4
Inox Wind
Neutral
205
-
4,538
5,605
6,267
15.7
16.4
24.8
30.0
8.3
6.8
2.3
1.7
25.9
24.4
0.9
0.7
KEC International
Neutral
124
-
3,179
9,294
10,186
7.9
8.1
9.9
11.9
12.5
10.4
1.8
1.6
15.6
16.3
0.6
0.5
Thermax
Neutral
852
-
10,154
5,421
5,940
7.3
7.3
25.7
30.2
33.2
28.2
4.0
3.7
12.2
13.1
1.8
1.6
VATech Wabag
Buy
464
681
2,527
3,136
3,845
8.9
9.1
26.0
35.9
17.8
12.9
2.2
1.9
13.4
15.9
0.7
0.6
Cement
ACC
Neutral
1,491
-
28,002
11,225
13,172
13.2
16.9
44.5
75.5
33.5
19.8
3.2
2.9
11.2
14.2
2.5
2.1
Ambuja Cements
Neutral
241
-
47,824
9,350
10,979
18.2
22.5
5.8
9.5
41.5
25.4
3.5
3.1
10.2
12.5
5.1
4.4
India Cements
Neutral
148
-
4,537
4,364
4,997
18.5
19.2
7.9
11.3
18.7
13.1
1.3
1.3
8.0
8.5
1.8
1.6
JK Cement
Neutral
857
-
5,994
4,398
5,173
15.5
17.5
31.2
55.5
27.5
15.4
3.3
2.9
12.0
15.5
1.9
1.6
J K Lakshmi Cement
Buy
467
565
5,491
2,913
3,412
14.5
19.5
7.5
22.5
62.2
20.7
3.8
3.2
12.5
18.0
2.5
2.1
Orient Cement
Buy
171
215
3,502
2,114
2,558
18.5
20.5
8.1
11.3
21.1
15.1
3.1
2.6
9.0
14.0
2.3
1.8
UltraTech Cement
Neutral
3,852
-
105,709
25,768
30,385
21.0
23.5
111.0
160.0
34.7
24.1
4.4
3.9
13.5
15.8
4.2
3.5
Construction
ITNL
Neutral
97
-
3,196
8,946
10,017
31.0
31.6
8.1
9.1
12.0
10.7
0.4
0.5
4.2
5.0
3.7
3.4
KNR Constructions
Accumulate
707
802
1,988
1,385
1,673
14.7
14.0
41.2
48.5
17.2
14.6
3.2
2.8
14.9
15.2
1.5
1.3
Larsen & Toubro
Buy
1,419
1,700
132,243
67,665
77,249
10.7
11.5
57.3
71.2
24.8
19.9
2.3
2.1
12.6
14.3
2.1
1.8
Gujarat Pipavav Port
Neutral
167
-
8,066
705
788
52.2
51.7
5.0
5.6
33.4
29.8
3.3
3.0
11.2
11.2
11.1
9.4
Nagarjuna Const.
Neutral
83
-
4,639
8,842
9,775
9.1
8.8
5.3
6.4
15.8
13.0
1.3
1.1
8.2
9.1
0.7
0.6
PNC Infratech
Buy
114
143
2,926
2,350
2,904
13.1
13.2
9.0
8.8
12.7
13.0
0.5
0.4
15.9
13.9
1.4
1.1
Simplex Infra
Neutral
321
-
1,587
6,829
7,954
10.5
10.5
31.4
37.4
10.2
8.6
1.1
1.0
9.9
13.4
0.7
0.6
Power Mech Projects
Neutral
480
-
706
1,801
2,219
12.7
14.6
72.1
113.9
6.7
4.2
1.2
1.0
16.8
11.9
0.4
0.3
Sadbhav Engineering
Accumulate
266
298
4,557
3,598
4,140
10.3
10.6
9.0
11.9
29.5
22.3
3.1
2.7
9.9
11.9
1.6
1.3
NBCC
Neutral
228
-
13,701
7,428
9,549
7.9
8.6
8.2
11.0
27.9
20.8
1.4
1.1
28.2
28.7
1.6
1.2
MEP Infra
Neutral
41
-
669
1,877
1,943
30.6
29.8
3.0
4.2
13.7
9.8
6.6
4.5
0.6
0.6
1.7
1.6
SIPL
Neutral
99
-
3,491
1,036
1,252
65.5
66.2
(8.4)
(5.6)
3.7
4.2
(22.8)
(15.9)
11.6
9.6
Stock Watch
November 07, 2016
Company Name
Reco
CMP
Target
Mkt Cap
Sales ( Čcr )
OPM(%)
EPS (Č)
PER(x)
P/BV(x)
RoE(%)
EV/Sales(x)
(Č)
Price ( Č)
( Č cr )
FY17E
FY18E
FY17E
FY18E
FY17E
FY18E
FY17E
FY18E
FY17E
FY18E
FY17E
FY18E
FY17E
FY18E
Construction
Engineers India
Neutral
246
-
8,277
1,725
1,935
16.0
19.1
11.4
13.9
21.6
17.7
3.0
2.9
13.4
15.3
3.7
3.3
Financials
Axis Bank
Buy
478
630
114,111
46,932
53,575
3.5
3.4
32.4
44.6
14.8
10.7
1.9
1.7
13.6
16.5
-
-
Bank of Baroda
Neutral
142
-
32,823
19,980
23,178
1.8
1.8
11.5
17.3
12.4
8.2
1.4
1.2
8.3
10.1
-
-
Canara Bank
Neutral
290
-
15,752
15,225
16,836
1.8
1.8
14.5
28.0
20.0
10.4
1.4
1.1
5.8
8.5
-
-
Dewan Housing Finance Buy
297
350
9,309
2,225
2,688
2.9
2.9
29.7
34.6
10.0
8.6
1.6
1.4
16.1
16.8
-
-
Equitas Holdings
Buy
172
235
5,780
939
1,281
11.7
11.5
5.8
8.2
29.7
21.0
2.6
2.3
10.9
11.5
-
-
Federal Bank
Neutral
77
-
13,161
9,353
10,623
2.9
2.9
4.4
5.8
17.4
13.2
1.7
1.5
9.5
11.0
-
-
HDFC
Neutral
1,386
-
219,106
11,475
13,450
3.4
3.4
45.3
52.5
30.6
26.4
5.9
5.2
20.2
20.5
-
-
HDFC Bank
Accumulate
1,244
1,350
314,873
46,097
55,433
4.5
4.5
58.4
68.0
21.3
18.3
3.7
3.1
18.8
18.6
-
-
ICICI Bank
Neutral
270
-
156,943
39,029
45,903
3.3
3.3
16.7
16.3
16.2
16.6
2.0
1.8
10.1
12.4
-
-
LIC Housing Finance
Buy
534
630
26,934
3,712
4,293
2.6
2.5
39.0
46.0
13.7
11.6
2.6
2.2
19.9
20.1
-
-
Punjab Natl.Bank
Neutral
132
-
28,004
23,532
23,595
2.3
2.4
6.8
12.6
19.4
10.4
3.0
2.1
3.3
6.5
-
-
RBL Bank
Neutral
366
-
13,533
1,783
2,309
2.6
2.6
12.7
16.4
28.8
22.3
3.1
2.8
12.8
13.3
-
-
South Ind.Bank
Neutral
23
-
3,045
6,435
7,578
2.5
2.5
2.7
3.1
8.4
7.3
1.1
0.9
10.1
11.2
-
-
St Bk of India
Neutral
243
-
188,519
88,650
98,335
2.6
2.6
13.5
18.8
18.0
12.9
1.7
1.5
7.0
8.5
-
-
Union Bank
Neutral
134
-
9,236
13,450
14,925
2.3
2.3
25.5
34.5
5.3
3.9
0.8
0.7
7.5
10.2
-
-
Yes Bank
Neutral
1,196
-
50,368
8,978
11,281
3.3
3.4
74.0
90.0
16.2
13.3
3.1
2.6
17.0
17.2
-
-
FMCG
Asian Paints
Neutral
1,043
-
100,011
17,128
18,978
16.8
16.4
19.1
20.7
54.6
50.4
19.0
17.9
34.8
35.5
5.8
5.2
Britannia
Accumulate
3,300
3,626
39,593
9,795
11,040
14.6
14.9
80.3
94.0
41.1
35.1
16.9
13.1
41.2
-
3.9
3.4
Colgate
Neutral
984
-
26,759
4,605
5,149
23.4
23.4
23.8
26.9
41.3
36.6
22.9
17.9
64.8
66.8
5.7
5.1
Dabur India
Neutral
297
-
52,273
8,315
9,405
19.8
20.7
8.1
9.2
36.7
32.3
10.2
8.5
31.6
31.0
5.9
5.2
GlaxoSmith Con*
Neutral
5,865
-
24,664
4,350
4,823
21.2
21.4
179.2
196.5
32.7
29.9
8.7
7.4
27.1
26.8
5.1
4.5
Godrej Consumer
Neutral
1,525
-
51,928
10,235
11,428
18.4
18.6
41.1
44.2
37.1
34.5
8.2
6.9
24.9
24.8
5.2
4.6
HUL
Neutral
847
-
183,398
35,252
38,495
17.8
17.8
20.7
22.4
41.0
37.9
39.2
33.6
95.6
88.9
5.0
4.6
ITC
Accumulate
249
284
300,684
40,059
44,439
38.3
39.2
9.0
10.1
27.7
24.6
7.7
6.8
27.8
27.5
7.0
6.3
Marico
Accumulate
263
300
33,906
6,430
7,349
18.8
19.5
6.4
7.7
41.1
34.1
12.4
10.4
33.2
32.5
5.1
4.4
Nestle*
Neutral
6,637
-
63,993
10,073
11,807
20.7
21.5
124.8
154.2
53.2
43.0
21.8
19.6
34.8
36.7
6.2
5.2
Tata Global
Neutral
127
-
8,006
8,675
9,088
9.8
9.8
7.4
8.2
17.1
15.5
1.9
1.9
7.9
8.1
0.8
0.8
Procter & Gamble
Accumulate
7,002
7,369
22,729
2,939
3,342
23.2
23.0
146.2
163.7
47.9
42.8
107.2
102.8
25.3
23.5
7.3
6.3
Hygiene
Stock Watch
November 07, 2016
Company Name
Reco
CMP
Target
Mkt Cap
Sales ( Čcr )
OPM(%)
EPS (Č)
PER(x)
P/BV(x)
RoE(%)
EV/Sales(x)
(Č)
Price ( Č)
( Č cr )
FY17E FY18E
FY17E
FY18E
FY17E
FY18E
FY17E
FY18E
FY17E
FY18E
FY17E
FY18E
FY17E
FY18E
IT
HCL Tech^
Buy
794
1,000
112,042
49,242
57,168
20.5
20.5
55.7
64.1
14.3
12.4
2.9
2.2
20.3
17.9
2.1
1.7
Infosys
Buy
971
1,249
222,987
68,350
77,326
27.0
27.0
62.5
69.4
15.5
14.0
3.3
3.0
21.3
21.6
2.7
2.3
TCS
Accumulate
2,330
2,620
459,129
119,025
133,308
27.6
27.6
131.2
145.5
17.8
16.0
5.8
5.3
32.4
33.1
3.6
3.2
Tech Mahindra
Buy
430
600
41,711
29,673
32,937
15.5
17.0
32.8
39.9
13.1
10.8
2.6
2.2
19.6
20.7
1.2
1.0
Wipro
Buy
452
590
109,978
55,440
60,430
18.1
18.1
35.9
39.9
12.6
11.3
2.3
2.1
19.0
19.3
1.7
1.6
Media
D B Corp
Neutral
379
-
6,969
2,297
2,590
27.4
28.2
21.0
23.4
18.1
16.2
4.2
3.7
23.7
23.1
2.8
2.4
HT Media
Neutral
80
-
1,865
2,693
2,991
12.6
12.9
7.9
9.0
10.2
8.9
0.9
0.8
7.8
8.3
0.3
0.2
Jagran Prakashan
Buy
184
225
6,012
2,355
2,635
28.0
28.0
10.8
12.5
17.0
14.7
3.7
3.2
21.7
21.7
2.6
2.3
Sun TV Network
Neutral
519
-
20,467
2,850
3,265
70.1
71.0
26.2
30.4
19.8
17.1
5.1
4.5
24.3
25.6
6.8
5.8
Hindustan Media
Neutral
292
-
2,146
1,016
1,138
24.3
25.2
27.3
30.1
10.7
9.7
2.0
1.8
16.2
15.8
1.4
1.2
Ventures
TV Today Network
Accumulate
340
385
2,029
637
743
27.5
27.5
18.4
21.4
18.5
15.9
3.2
2.7
17.4
17.2
2.8
2.3
Metals & Mining
Coal India
Neutral
316
-
199,281
84,638
94,297
21.4
22.3
24.5
27.1
12.9
11.6
5.4
5.1
42.6
46.0
1.9
1.7
Hind. Zinc
Neutral
255
-
107,872
14,252
18,465
55.9
48.3
15.8
21.5
16.2
11.9
2.6
2.3
17.0
20.7
7.6
5.8
Hindalco
Neutral
158
-
32,668
107,899
112,095
7.4
8.2
9.2
13.0
17.2
12.2
0.8
0.8
4.8
6.6
0.8
0.8
JSW Steel
Neutral
1,589
-
38,413
53,201
58,779
16.1
16.2
130.6
153.7
12.2
10.3
1.6
1.4
14.0
14.4
1.5
1.3
NMDC
Neutral
127
-
50,352
6,643
7,284
44.4
47.7
7.1
7.7
17.9
16.5
1.6
1.5
8.8
9.2
5.3
4.8
SAIL
Neutral
50
-
20,712
47,528
53,738
(0.7)
2.1
(1.9)
2.6
19.3
0.6
0.5
(1.6)
3.9
1.3
1.2
Vedanta
Neutral
213
-
63,074
71,744
81,944
19.2
21.7
13.4
20.1
15.9
10.6
1.4
1.2
8.4
11.3
1.3
1.0
Tata Steel
Neutral
403
-
39,145
121,374
121,856
7.2
8.4
18.6
34.3
21.7
11.8
1.4
1.2
6.1
10.1
1.0
0.9
Oil & Gas
Cairn India
Neutral
237
-
44,406
9,127
10,632
4.3
20.6
8.8
11.7
26.9
20.2
0.9
0.8
3.3
4.2
6.3
5.3
GAIL
Neutral
424
-
53,821
56,220
65,198
9.3
10.1
27.1
33.3
15.7
12.7
1.4
1.3
9.3
10.7
1.1
1.0
ONGC
Neutral
270
-
230,699
137,222
152,563
15.0
21.8
19.5
24.1
13.8
11.2
1.2
1.1
8.5
10.1
2.0
1.8
Indian Oil Corp
Neutral
306
-
148,591
373,359
428,656
5.9
5.5
54.0
59.3
5.7
5.2
0.9
0.8
16.0
15.6
0.6
0.5
Reliance Industries
Neutral
1,006
-
326,125
301,963
358,039
12.1
12.6
87.7
101.7
11.5
9.9
1.2
1.1
10.7
11.3
1.6
1.3
Pharmaceuticals
Alembic Pharma
Neutral
656
-
12,364
3,483
4,083
20.2
21.4
24.3
30.4
27.0
21.6
6.2
4.9
25.5
25.3
3.5
2.9
Aurobindo Pharma
Buy
727
877
42,527
15,720
18,078
23.7
23.7
41.4
47.3
17.6
15.4
4.6
3.6
29.6
26.1
2.9
2.5
Aventis*
Neutral
4,276
-
9,847
2,357
2,692
17.3
17.3
153.5
169.2
27.9
25.3
4.7
3.8
25.8
28.4
3.9
3.1
Cadila Healthcare
Neutral
390
-
39,967
11,126
13,148
22.0
22.0
17.1
20.0
22.8
19.5
5.9
4.7
28.8
26.6
3.6
2.9
Cipla
Neutral
545
-
43,754
15,378
18,089
17.4
18.4
21.6
27.2
25.2
20.0
3.3
2.8
13.7
15.2
3.1
2.5
Stock Watch
November 07, 2016
Company Name
Reco
CMP
Target
Mkt Cap
Sales ( Čcr )
OPM(%)
EPS (Č)
PER(x)
P/BV(x)
RoE(%)
EV/Sales(x)
(Č)
Price ( Č)
( Č cr )
FY17E FY18E
FY17E
FY18E
FY17E
FY18E
FY17E
FY18E
FY17E
FY18E
FY17E
FY18E
FY17E
FY18E
Pharmaceuticals
Dr Reddy's
Neutral
3,077
-
50,988
16,043
18,119
23.1
24.7
126.0
157.8
24.4
19.5
3.6
3.1
15.7
17.1
3.1
2.7
Dishman Pharma
Neutral
227
-
3,660
1,718
1,890
22.7
22.8
9.5
11.3
23.9
20.1
2.3
2.1
10.1
10.9
2.6
2.3
GSK Pharma*
Neutral
2,775
-
23,503
3,528
3,811
16.6
18.8
51.8
59.4
53.6
46.7
14.3
14.3
26.3
30.6
6.4
6.0
Indoco Remedies
Neutral
276
-
2,542
1,112
1,289
18.2
18.2
13.2
15.6
20.9
17.7
3.7
3.2
19.2
19.2
2.4
2.1
Ipca labs
Accumulate
583
613
7,356
3,303
3,799
15.3
15.3
17.3
19.7
33.7
29.6
2.9
2.7
9.1
9.4
2.4
2.0
Lupin
Buy
1,421
1,809
64,060
15,912
18,644
26.4
26.7
58.1
69.3
24.5
20.5
4.8
3.9
21.4
20.9
4.1
3.4
Sun Pharma
Buy
653
944
157,097
31,129
35,258
30.0
30.9
28.0
32.8
23.3
19.9
3.6
3.0
18.7
18.9
4.6
3.9
Power
Tata Power
Neutral
75
-
20,177
36,916
39,557
17.4
27.1
5.1
6.3
14.6
11.8
1.3
1.2
9.0
10.3
1.6
1.4
NTPC
Neutral
153
-
126,485
86,605
95,545
17.5
20.8
11.8
13.4
13.0
11.5
1.3
1.2
10.5
11.1
2.8
2.8
Power Grid
Neutral
173
-
90,742
25,763
29,762
74.3
73.1
14.8
17.3
11.7
10.0
1.8
1.6
16.9
17.5
7.8
7.4
Real Estate
Prestige Estate
Buy
182
210
6,808
4,707
5,105
25.2
26.0
10.3
13.0
17.6
14.0
1.4
1.3
10.3
10.2
2.6
2.3
MLIFE
Buy
406
522
1,664
1,152
1,300
22.7
24.6
29.9
35.8
13.6
11.3
1.0
0.9
7.6
8.6
2.2
1.8
Telecom
Bharti Airtel
Neutral
307
-
122,640
105,086
114,808
34.5
34.7
12.2
16.4
25.2
18.7
1.7
1.6
6.8
8.4
2.1
1.8
Idea Cellular
Neutral
72
-
25,944
40,133
43,731
37.2
37.1
6.4
6.5
11.3
11.1
0.9
0.9
8.2
7.6
1.7
1.4
zOthers
Abbott India
Neutral
4,695
-
9,977
3,153
3,583
14.1
14.4
152.2
182.7
30.9
25.7
151.5
129.3
25.6
26.1
2.9
2.5
Asian Granito
Buy
260
351
782
1,071
1,182
12.1
12.4
12.7
16.0
20.4
16.3
2.0
1.7
9.5
10.7
1.0
0.9
Bajaj Electricals
Buy
250
306
2,521
5,099
5,805
5.6
5.9
11.4
14.6
21.9
17.1
2.9
2.6
13.4
15.1
0.5
0.4
Banco Products (India)
Neutral
205
-
1,465
1,353
1,471
12.3
12.4
14.5
16.3
14.1
12.6
19.5
17.6
14.5
14.6
1.0
109.7
Coffee Day Enterprises
Neutral
218
-
4,493
2,964
3,260
20.5
21.2
4.7
8.0
-
27.3
2.5
2.3
5.5
8.5
1.9
1.7
Ltd
Competent Automobiles Neutral
188
-
116
1,137
1,256
3.1
2.7
28.0
23.6
6.7
8.0
36.2
32.7
14.3
11.5
0.1
0.1
Elecon Engineering
Neutral
61
-
667
1,482
1,660
13.7
14.5
3.9
5.8
15.7
10.6
3.7
3.4
7.8
10.9
0.8
0.7
Finolex Cables
Neutral
434
-
6,640
2,883
3,115
12.0
12.1
14.2
18.6
30.6
23.3
16.3
14.2
15.8
14.6
2.0
1.8
Garware Wall Ropes
Neutral
526
-
1,150
873
938
12.9
13.1
30.9
34.9
17.0
15.1
2.7
2.3
15.7
15.2
1.2
1.1
Goodyear India*
Neutral
764
-
1,763
1,598
1,704
10.4
10.2
49.4
52.6
15.5
14.5
71.4
62.6
18.2
17.0
0.8
110.5
Hitachi
Neutral
1,444
-
3,926
2,081
2,433
8.8
8.9
33.4
39.9
43.2
36.2
34.9
29.1
22.1
21.4
1.9
1.6
HSIL
Neutral
344
-
2,483
2,384
2,515
15.8
16.3
15.3
19.4
22.5
17.7
22.3
19.2
7.8
9.3
1.2
1.1
Interglobe Aviation
Neutral
920
-
33,144
21,122
26,005
14.5
27.6
110.7
132.1
8.3
7.0
49.7
35.5
168.5
201.1
1.5
1.2
Jyothy Laboratories
Neutral
348
-
6,324
1,440
2,052
11.5
13.0
8.5
10.0
41.0
34.8
9.9
9.2
18.6
19.3
4.7
3.3
Kirloskar Engines India
Neutral
345
-
4,982
2,554
2,800
9.9
10.0
10.5
12.1
32.8
28.5
13.7
13.0
10.7
11.7
1.6
1.4
Ltd
Stock Watch
November 07, 2016
Company Name
Reco
CMP
Target
Mkt Cap
Sales ( Čcr )
OPM(%)
EPS (Č)
PER(x)
P/BV(x)
RoE(%)
EV/Sales(x)
(Č)
Price ( Č)
( Č cr )
FY17E
FY18E
FY17E
FY18E
FY17E
FY18E
FY17E
FY18E
FY17E
FY18E
FY17E
FY18E
FY17E
FY18E
zOthers
Linc Pen & Plastics
Neutral
254
-
376
382
420
9.3
9.5
13.5
15.7
18.9
16.2
3.2
2.8
17.1
17.3
1.1
0.9
M M Forgings
Neutral
436
-
527
546
608
20.4
20.7
41.3
48.7
10.6
9.0
59.8
52.9
16.6
17.0
0.8
0.7
Manpasand Bever.
Neutral
704
-
4,024
836
1,087
19.6
19.4
16.9
23.8
41.6
29.5
5.0
4.4
12.0
14.8
4.6
3.4
Mirza International
Buy
88
113
1,059
1,024
1,148
18.0
18.0
6.9
8.0
12.8
11.0
2.2
1.8
16.6
16.2
1.2
1.1
MT Educare
Neutral
134
-
532
366
417
17.7
18.2
9.4
10.8
14.3
12.4
3.2
2.8
22.2
22.3
1.4
1.2
Narayana Hrudaya
Neutral
338
-
6,909
1,873
2,166
11.5
11.7
2.6
4.0
127.8
85.3
7.8
7.1
6.1
8.3
3.8
3.3
Navkar Corporation
Buy
196
265
2,792
408
612
42.9
42.3
6.8
11.5
28.9
17.0
2.0
1.8
6.9
10.5
7.8
5.2
Navneet Education
Neutral
100
-
2,381
1,062
1,147
24.0
24.0
6.1
6.6
16.4
15.1
3.4
3.0
20.6
19.8
2.3
2.1
Nilkamal
Neutral
1,648
-
2,459
1,995
2,165
10.7
10.4
69.8
80.6
23.6
20.5
94.2
81.8
16.6
16.5
1.2
1.1
Page Industries
Neutral
15,766
-
17,585
2,450
3,124
20.1
17.6
299.0
310.0
52.7
50.9
351.1
268.0
47.1
87.5
7.2
5.7
Parag Milk Foods
Neutral
299
-
2,511
1,919
2,231
9.3
9.6
9.5
12.9
31.6
23.1
4.9
4.1
15.5
17.5
1.5
1.2
Quick Heal
Neutral
233
-
1,631
408
495
27.3
27.0
7.7
8.8
30.1
26.5
2.8
2.8
9.3
10.6
3.1
2.6
Radico Khaitan
Neutral
138
-
1,839
1,659
1,802
13.0
13.2
6.3
7.4
21.8
18.7
1.9
1.7
8.6
9.3
1.5
1.4
Relaxo Footwears
Neutral
411
-
4,931
2,085
2,469
9.2
8.2
7.6
8.0
54.3
51.7
21.1
18.0
17.9
18.8
2.5
2.1
S H Kelkar & Co.
Neutral
306
-
4,422
1,036
1,160
15.1
15.0
6.1
7.2
50.1
42.6
5.4
4.9
10.7
11.5
4.1
3.7
Siyaram Silk Mills
Accumulate
1,528
1,714
1,432
1,799
2,040
11.6
11.7
104.9
122.4
14.6
12.5
2.4
2.1
16.4
16.4
1.0
0.9
Styrolution ABS India*
Neutral
613
-
1,078
1,440
1,537
9.2
9.0
40.6
42.6
15.1
14.4
38.6
35.0
12.3
11.6
0.7
0.6
Surya Roshni
Neutral
223
-
976
3,342
3,625
7.8
7.5
17.3
19.8
12.9
11.3
24.5
19.6
10.5
10.8
0.5
0.5
Team Lease Serv.
Neutral
1,020
-
1,744
3,229
4,001
1.5
1.8
22.8
32.8
44.8
31.1
4.8
4.2
10.7
13.4
0.4
0.3
The Byke Hospitality
Neutral
183
-
734
287
384
20.5
20.5
7.6
10.7
24.1
17.1
5.0
4.1
20.7
23.5
2.6
1.9
Transport Corporation of
Neutral
184
-
1,407
2,671
2,911
8.5
8.8
13.9
15.7
13.3
11.7
1.8
1.6
13.7
13.8
0.6
0.6
India
TVS Srichakra
Neutral
3,715
-
2,844
2,304
2,614
13.7
13.8
231.1
266.6
16.1
13.9
417.4
328.6
33.9
29.3
1.2
1.1
UFO Moviez
Neutral
465
-
1,284
619
685
33.2
33.4
30.0
34.9
15.5
13.3
2.2
1.9
13.8
13.9
1.8
1.4
Visaka Industries
Neutral
214
-
340
1,051
1,138
10.3
10.4
21.0
23.1
10.2
9.3
27.5
25.7
9.0
9.2
0.6
0.6
VRL Logistics
Neutral
285
-
2,598
1,902
2,119
16.7
16.6
14.6
16.8
19.6
16.9
4.3
3.8
21.9
22.2
1.5
1.3
Wonderla Holidays
Neutral
373
-
2,106
287
355
38.0
40.0
11.3
14.2
33.0
26.3
4.7
4.1
21.4
23.9
7.0
5.7
Source: Company, Angel Research; Note: *December year end; #September year end; &October year end; Price as on November 04, 2016
Market Outlook
November 07, 2016
Research Team Tel: 022 - 39357800
DISCLAIMER
Angel Broking Private Limited (hereinafter referred to as “Angel”) is a registered Member of National Stock Exchange of India
Limited,Bombay Stock Exchange Limited and Metropolitan Stock Exchange Limited. It is also registered as a Depository Participant with
CDSL and Portfolio Manager with SEBI. It also has registration with AMFI as a Mutual Fund Distributor. Angel Broking Private Limited is a
registered entity with SEBI for Research Analyst in terms of SEBI (Research Analyst) Regulations, 2014 vide registration number
INH000000164. Angel or its associates has not been debarred/ suspended by SEBI or any other regulatory authority for accessing
/dealing in securities Market. Angel or its associates/analyst has not received any compensation / managed or
co-managed public offering of securities of the company covered by Analyst during the past twelve months.
This document is solely for the personal information of the recipient, and must not be singularly used as the basis of any investment
decision. Nothing in this document should be construed as investment or financial advice. Each recipient of this document should make
such investigations as they deem necessary to arrive at an independent evaluation of an investment in the securities of the companies
referred to in this document (including the merits and risks involved), and should consult their own advisors to determine the merits and
risks of such an investment.
Reports based on technical and derivative analysis center on studying charts of a stock's price movement, outstanding positions and
trading volume, as opposed to focusing on a company's fundamentals and, as such, may not match with a report on a company's
fundamentals. Investors are advised to refer the Fundamental and Technical Research Reports available on our website to evaluate the
contrary view, if any.
The information in this document has been printed on the basis of publicly available information, internal data and other reliable
sources believed to be true, but we do not represent that it is accurate or complete and it should not be relied on as such, as this
document is for general guidance only. Angel Broking Pvt. Limited or any of its affiliates/ group companies shall not be in any way
responsible for any loss or damage that may arise to any person from any inadvertent error in the information contained in this report.
Angel Broking Pvt. Limited has not independently verified all the information contained within this document. Accordingly, we cannot
testify, nor make any representation or warranty, express or implied, to the accuracy, contents or data contained within this document.
While Angel Broking Pvt. Limited endeavors to update on a reasonable basis the information discussed in this material, there may be
regulatory, compliance, or other reasons that prevent us from doing so.
This document is being supplied to you solely for your information, and its contents, information or data may not be reproduced,
redistributed or passed on, directly or indirectly.
Neither Angel Broking Pvt. Limited, nor its directors, employees or affiliates shall be liable for any loss or damage that may arise from
or in connection with the use of this information.